Bitcoin at $63K — Storm Before the Surge?

Bitcoin

💰 Current Bitcoin Price

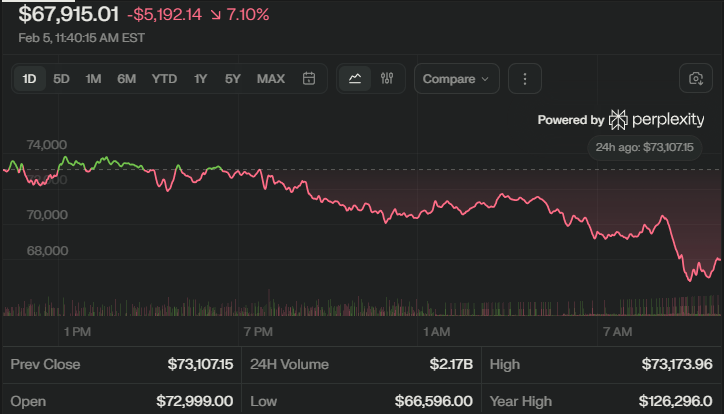
As of February 28, 2026, Bitcoin (BTC) is trading near $63,000 USD, with price feeds reporting:

  • $63,191 (down 6.35% in 24 hours)
  • $63,562 (down 2.05% intraday)

The total market capitalization fluctuates between $1.27 trillion and $1.31 trillion, while 24-hour trading volumes exceed $36–$42 billion, signaling intense activity and volatility.

Bitcoin


Bitcoin has experienced sharp swings in late February:

  • Dropped below $63,000 on February 23 amid tariff tensions and geopolitical uncertainty.
  • Touched intraday lows near $62,964 before partial recovery.
  • Previously rebounded toward $68,000 on ETF inflows.
  • Earlier peaked above $80,000 in early February before erasing nearly $200B in market value within a week.
  • 7-day declines reached up to 12%.

Recent 24-hour price ranges fluctuated between $63,509 and $68,021, highlighting persistent volatility.

🌍 Key Influences Driving Bitcoin

Several macro and structural factors are shaping BTC’s price action:

  • US Tariffs & Policy Moves: Trade tensions triggered broad risk-off sentiment.
  • Strong US Jobs Data: Reduced expectations for rate cuts.
  • Mass Liquidations: Over $2.56B wiped out in a single day.
  • ETF Inflows: Provided short-term support and institutional demand.
  • Altcoin Recovery: Ethereum and major altcoins saw temporary rebounds.

🔮 Analyst Forecasts for 2026

Market forecasts remain divided:

  • Standard Chartered revised its 2026 Bitcoin target to $100,000 (down from $150,000).
  • Some analysts warn of a potential dip toward $50,000 before recovery.
  • Short-term consolidation expected between $67,500–$70,000.
  • Prediction markets suggest $58,000+ as a potential late-February floor.

📊 Broader Market Context

Bitcoin’s fundamentals remain strong despite turbulence:

  • Circulating supply: Nearly 20 million BTC out of 21 million max.
  • Treasury holdings: Approximately 1.17 million BTC.
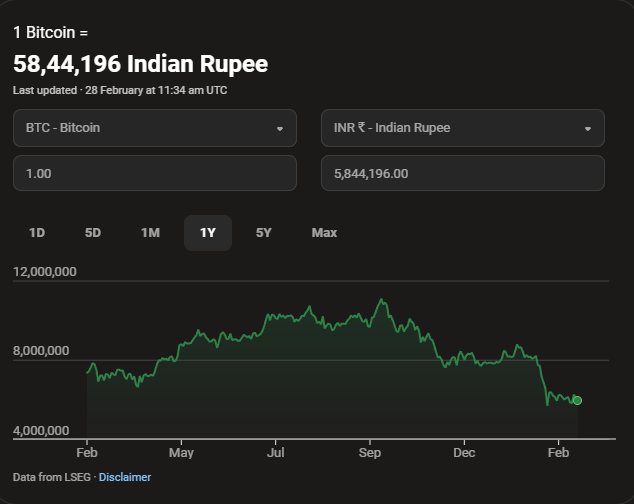
  • Yearly decline: Around 22% from peaks above $119,000.

Volatility continues amid bond yield shifts, inflation data anticipation, and broader macroeconomic signals. Institutional ETF demand provides underlying resilience despite market stress.

📈 Investor Outlook: Crash or Opportunity?

With Bitcoin hovering near $63K, investors face a pivotal moment. If support levels fail, deeper corrections could emerge. However, strong institutional participation and supply constraints suggest potential upside once macro pressures ease.


Bitcoin remains in a high-volatility zone. Smart investors are closely watching inflation data, Federal Reserve signals, and ETF flows before making decisive moves.


Stay Updated. Stay Strategic. The Crypto Market Never Sleeps.

Read more

Bitcoin Crashes Below $70K: Crypto Winter Strikes 2026

Bitcoin

“From Moon to Meltdown — Bitcoin Enters Its Coldest Phase.”


Bitcoin has witnessed a sharp sell-off, sliding to $67,878 USD on February 5, 2026, marking a steep 7% daily drop. The fall has erased over $5,100 in value within 24 hours and pushed the market into what analysts are calling the “2026 crypto winter.” The flagship cryptocurrency is now far below its recent highs, shaking investor confidence.


Table of Contents

  1. Current Market Stats
  2. Recent Price Movements
  3. Key Influences Behind the Drop
  4. Technical Indicators & Sentiment
  5. Short-Term Outlook & Predictions


Current Market Stats

Bitcoin opened the day at $72,999, briefly touched a high of $73,174, and plunged to an intraday low of $66,596, highlighting intense volatility.

  • Current Price: $67,878
  • 24H Volume: $2.16 Billion+
  • Market Cap: ~$1.35 Trillion
  • YTD High: $126,296
  • YTD Low: $66,596

Bitcoin

Recent Price Movements

After stabilizing near $78,900 following a liquidity-driven weekend sell-off, Bitcoin came under renewed pressure. A strengthening US dollar, persistent inflation concerns, and hawkish Federal Reserve expectations triggered another wave of selling.

The recent dip wiped out gains from the $97,000 rally seen just weeks ago. Adding to the fear, MicroStrategy disclosed over $3.8 billion in unrealized Bitcoin losses, amplifying bearish sentiment.


Key Influences Behind the Drop

  • Stronger US dollar and Fed policy uncertainty
  • Thin weekend liquidity exaggerating sell-offs
  • Macro concerns from US trade and monetary policy
  • Profit booking after failed breakout above $90K
  • Mixed sentiment despite ongoing ETF inflows


Technical Indicators & Market Sentiment

Bitcoin is now trading below both its key moving averages:

  • 50-Day MA: $88,443
  • 200-Day MA: $103,303

This confirms a strong bearish trend. The Fear & Greed Index has dropped to 14 (Extreme Fear), while bullish probability stands at just 13%. Analysts warn that if the $75,000–$67,000 support zone fails, prices could slide toward $38,000.


Short-Term Outlook & Predictions

Despite the crash, short-term models suggest a possible relief bounce:

  • Feb 6 Forecast: $76,440
  • February End Target: $80,957
  • Average Feb Price: $78,665

However, resistance near $80,000 remains strong. Veteran critics like Peter Schiff caution against chasing rallies, especially after MicroStrategy’s recent $1.25 billion Bitcoin purchase. Market recovery toward a $3 trillion global crypto cap depends heavily on buyers defending current levels.


Bitcoin’s sharp decline signals a crucial moment for the crypto market. While short-term rebounds are possible, volatility and macro uncertainty dominate the landscape. Investors are advised to stay cautious, monitor key support levels, and track global economic cues closely as the 2026 crypto winter unfolds.


Disclaimer: Yeh views market experts ke hain and not of trueincome. Investment karne se pehle certified advisor se consult zaroor karein.

Read more